RGSoC2020 hyperSpec
Student: Erick Oduniyi; Project: hyperSpec
This .md file contains notes and solutions for the RGSoC2020 hyperSpec test.
1. Easy
Task: Install hyperSpec, covr and lintr from CRAN and hyperSpec.tidyverse from github.
# Install hyperSpec, covr, and lintr packages from CRAN
install.packages("hyperSpec")
install.packages("lintr")
install.packages("covr")

# Install hyperSpec.tidyverse package from github
remotes::install_github("cbeleites/hyperSpec.tidyverse")
The downloaded binary packages are in
/var/folders/4_/gg3mjn693bz4v5w1sxh71rtc0000gp/T//RtmpltRTPs/downloaded_packages
also installing the dependencies ‘cyclocomp’, ‘xmlparsedata’
The downloaded binary packages are in
/var/folders/4_/gg3mjn693bz4v5w1sxh71rtc0000gp/T//RtmpltRTPs/downloaded_packages
The downloaded binary packages are in
/var/folders/4_/gg3mjn693bz4v5w1sxh71rtc0000gp/T//RtmpltRTPs/downloaded_packages
Downloading GitHub repo cbeleites/hyperSpec.tidyverse@master
[32m✔[39m [38;5;247mchecking for file ‘/private/var/folders/4_/gg3mjn693bz4v5w1sxh71rtc0000gp/T/RtmpltRTPs/remotes81a11e602b6a/cbeleites-hyperSpec.tidyverse-d2122a6/DESCRIPTION’[39m[36m[39m
[38;5;247m─[39m[38;5;247m [39m[38;5;247mpreparing ‘hyperSpec.tidyverse’:[39m[36m[39m
[32m✔[39m [38;5;247mchecking DESCRIPTION meta-information[39m[36m[39m
[38;5;247m─[39m[38;5;247m [39m[38;5;247mchecking for LF line-endings in source and make files and shell scripts[39m[36m[39m
[38;5;247m─[39m[38;5;247m [39m[38;5;247mchecking for empty or unneeded directories[39m[36m[39m
[38;5;247m─[39m[38;5;247m [39m[38;5;247mbuilding ‘hyperSpec.tidyverse_0.1.0.tar.gz’[39m[36m[39m
2. Medium
Task: Fork hyperSpec from github, use lintr to standardize code formatting, and submit a pull request with the improved code.
2.1. The nature of linting tools
In general, linting is a way to automatically debug code (i.e., error checking and code standardization) without executing the program. Linters aren’t intelligent, so it only tries to adhere to a grammar and thus can only check for potential errors.
There are two categories of linting: code style linting and syntax linting. There is no right or wrong way to lint, so it’s important to choose a linting style (i.e., style convention) that fits the project.
Linting is super helpful because it helps programmers adhere to style conventions. In the context of working on open source projects, this can add a bit of confidence to a programmers contribution, which of course is related to unit testing and continuous integration.
2.2. Applying lintr to hyperSpec
The lintr package is a very nice way to checks adherence to a given style, syntax errors and possible semantic issues.
# Load lintr package
library(lintr)

# Go to the directory of hyperSpec source files
setwd("/path/to/directory/R")

# Check directory
list.files()
# Try using the lintr package on a single file
lint("aggregate.R")
[1m/path/to/directory/aggregate.R:1:1: [22m[34mstyle: [39m[1mLines should not be more than 80 characters.[22m
.aggregate <- function (x, by = stop ("by is needed"), FUN = stop ("FUN is needed."),
^~~~~~~~~~~~~~~~~~~~~~~~~~~~~~~~~~~~~~~~~~~~~~~~~~~~~~~~~~~~~~~~~~~~~~~~~~~~~~~~~~~~~
[1m/path/to/directory/aggregate.R:1:24: [22m[34mstyle: [39m[1mRemove spaces before the left parenthesis in a function call.[22m
.aggregate <- function (x, by = stop ("by is needed"), FUN = stop ("FUN is needed."),
^
[1m/path/to/directory/aggregate.R:1:38: [22m[34mstyle: [39m[1mRemove spaces before the left parenthesis in a function call.[22m
.aggregate <- function (x, by = stop ("by is needed"), FUN = stop ("FUN is needed."),
^
[1m/path/to/directory/aggregate.R:1:56: [22m[34mstyle: [39m[1mVariable and function name style should be snake_case.[22m
.aggregate <- function (x, by = stop ("by is needed"), FUN = stop ("FUN is needed."),
^~~
[1m/path/to/directory/aggregate.R:1:67: [22m[34mstyle: [39m[1mRemove spaces before the left parenthesis in a function call.[22m
.aggregate <- function (x, by = stop ("by is needed"), FUN = stop ("FUN is needed."),
^ To get a better sense of the types of style suggestions `lintr` is proposing:
# Collect lintr suggestions
lint.sugg <- lint("aggregate.R")

# Turn suggestions into a data frame
lint.df <- as.data.frame(lint.comments)
head(lint.df, 3)
| filename | line_number | column_number | type | message | line | linter |
|---|---|---|---|---|---|---|
| <chr> | <dbl> | <dbl> | <chr> | <chr> | <chr> | <chr> |
| /path/to/directory/aggregate.R | 1 | 1 | style | <span style=white-space:pre-wrap>Lines should not be more than 80 characters. </span> | <span style=white-space:pre-wrap>.aggregate <- function (x, by = stop ("by is needed"), FUN = stop ("FUN is needed."), </span> | <span style=white-space:pre-wrap>line_length_linter </span> |
| /path/to/directory/aggregate.R | 1 | 24 | style | <span style=white-space:pre-wrap>Remove spaces before the left parenthesis in a function call. </span> | <span style=white-space:pre-wrap>.aggregate <- function (x, by = stop ("by is needed"), FUN = stop ("FUN is needed."), </span> | function_left_parentheses_linter |
| /path/to/directory/aggregate.R | 1 | 38 | style | <span style=white-space:pre-wrap>Remove spaces before the left parenthesis in a function call. </span> | <span style=white-space:pre-wrap>.aggregate <- function (x, by = stop ("by is needed"), FUN = stop ("FUN is needed."), </span> | function_left_parentheses_linter |
Additionally, lintr can be integrated with Atom’s Linter for “on the fly linting”:
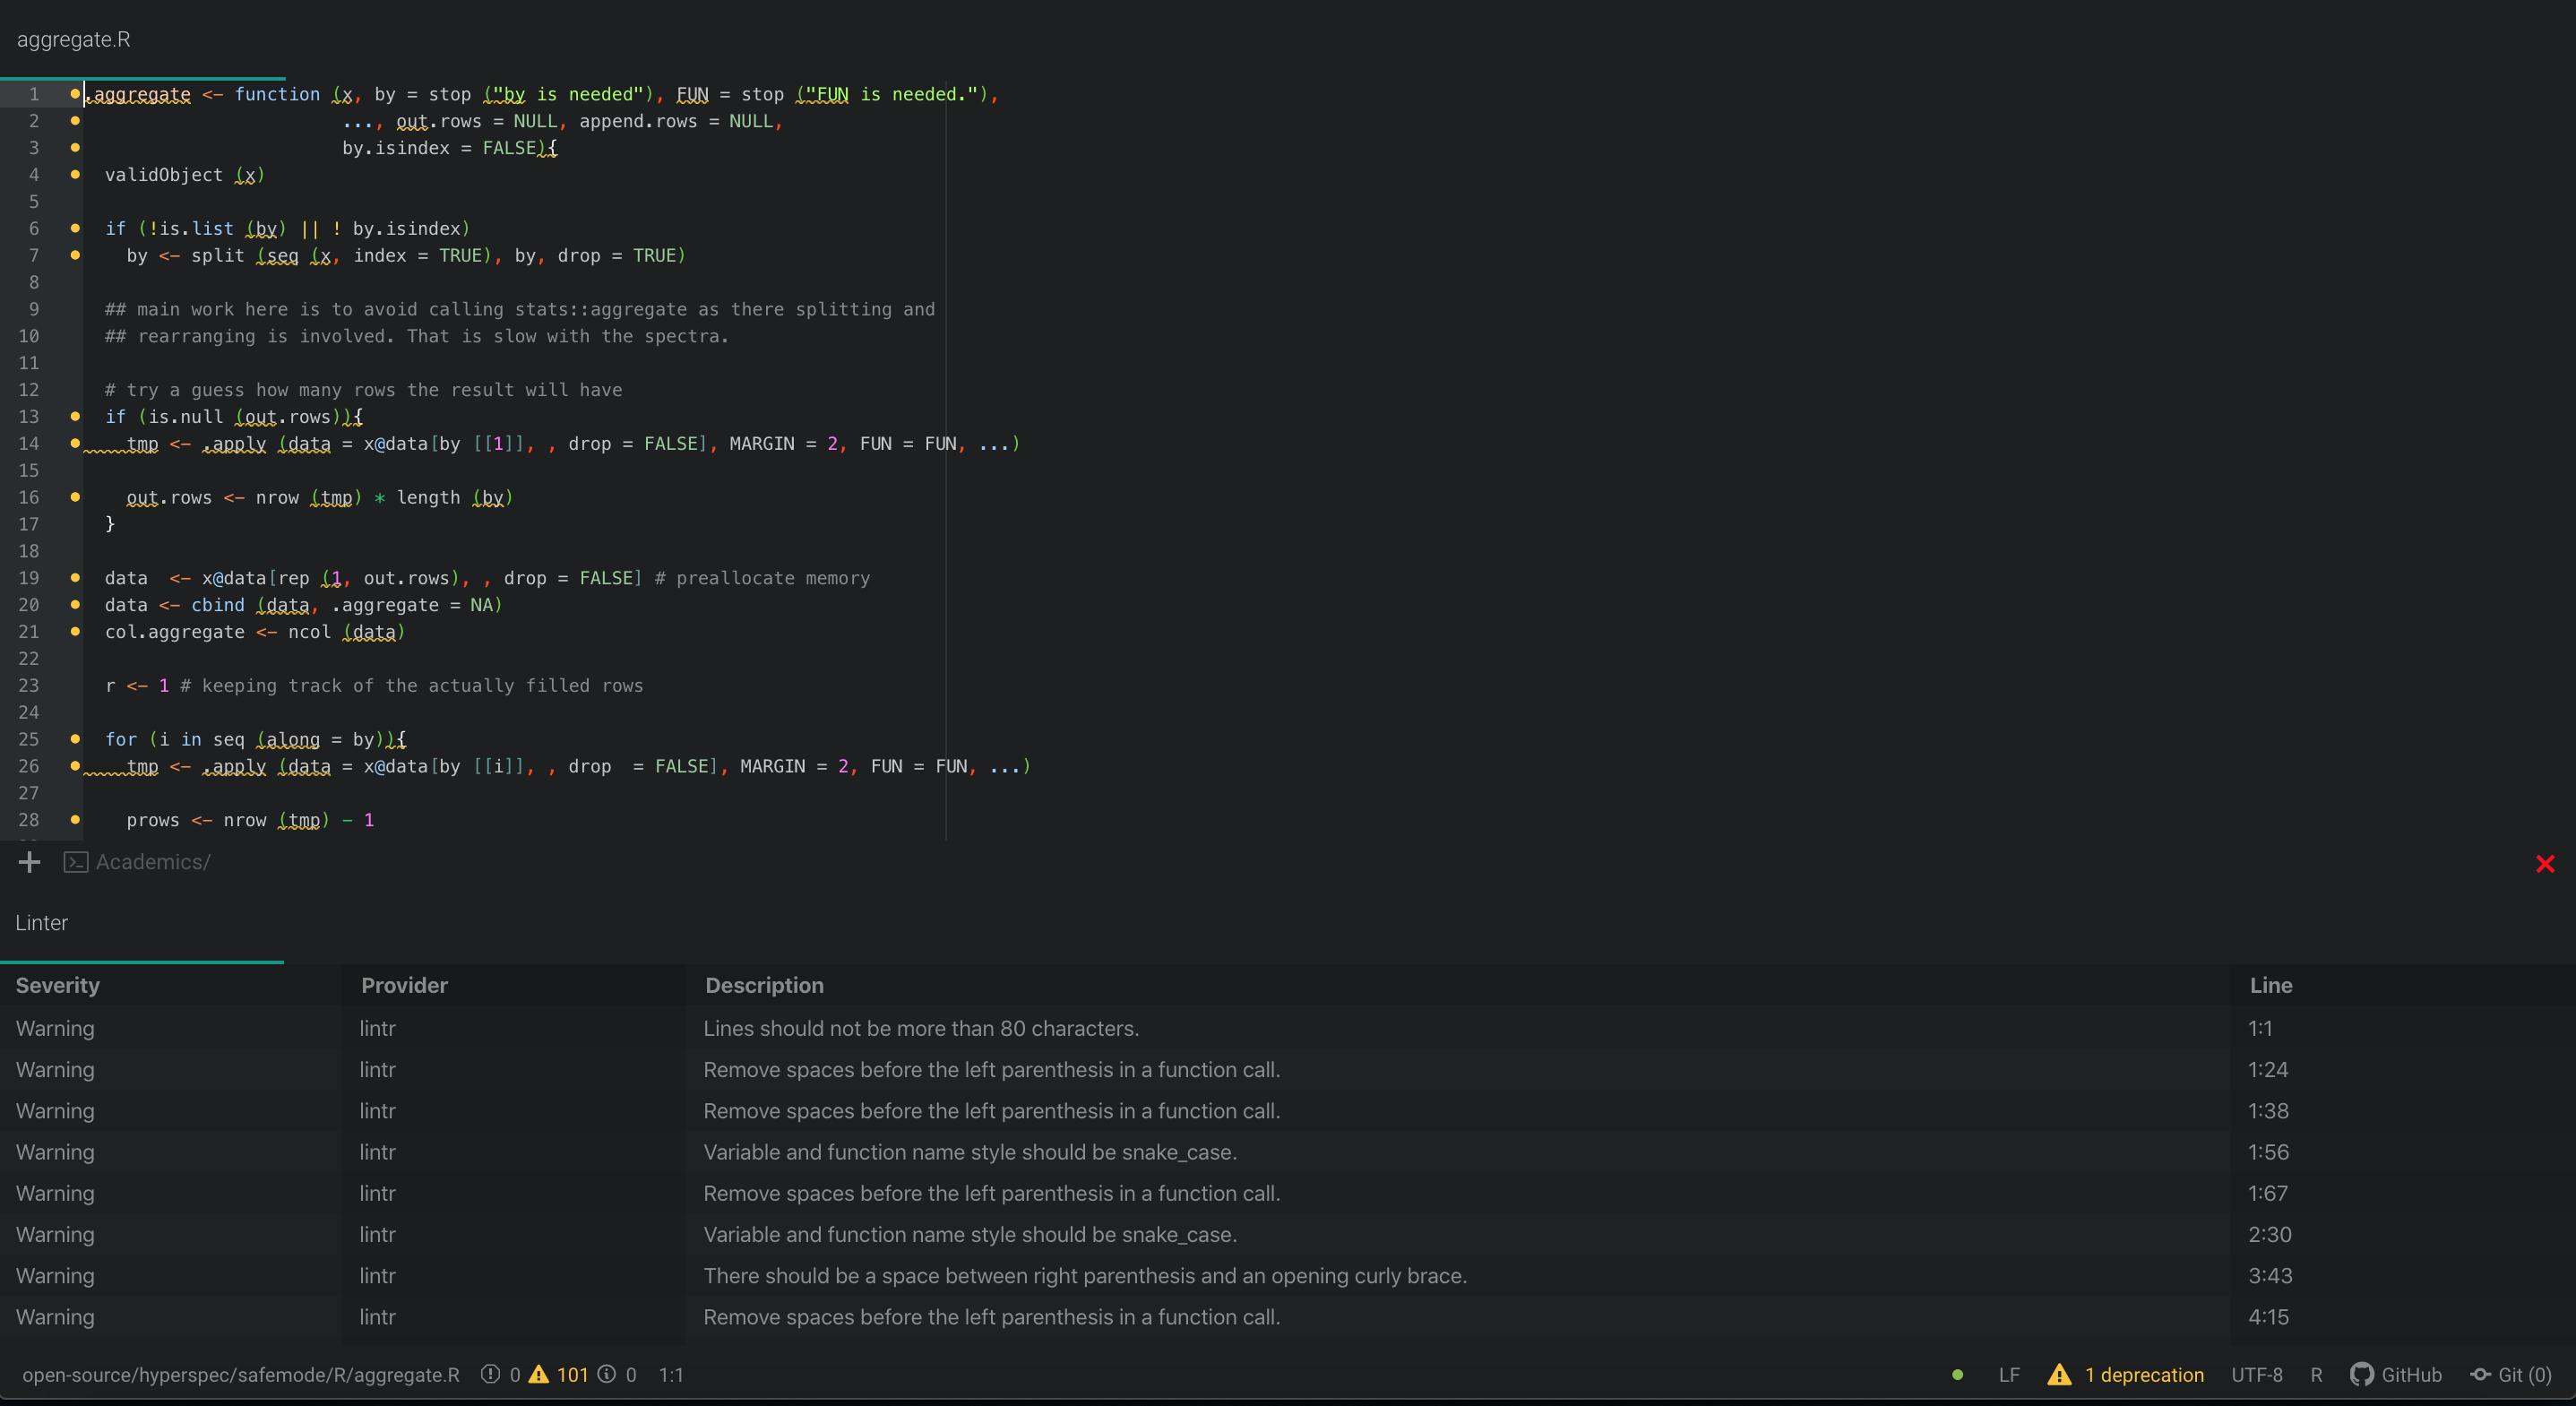
While lintr gives you comments and suggestions related to your code, itself does not make any changes. Hence, the user must decide whether the changes should be made or rejected. Though this is mostly a good thing, if your code base contains more than 100 files that need to be lint, reviewing and manually implementing these suggestions can be cumbersome. Luckily, issue #96 - Consistent code style hints at using the styler package.
2.3. Applying styler to hyperSpec
The styler package helps R user systematically enforce style across single R files and even entire packages and directories.
# Install the styler package from CRAN
install.packages("styler")
also installing the dependencies ‘R.methodsS3’, ‘R.oo’, ‘R.utils’, ‘R.cache’, ‘rematch2’

The downloaded binary packages are in
	/var/folders/4_/gg3mjn693bz4v5w1sxh71rtc0000gp/T/RtmpltRTPs/downloaded_packages
The styler package has a lot of customization capability, and so it’s possible to define your own style guide or style transformers that the package will enforce when styling code. For testing purposes, we’ll adhere to the tidyverse style guidelines:
# Load styler library
library(styler)

# Adhere do tidyverse style guide
tidyverse <- tidyverse_style(
  scope = "tokens",
  strict = TRUE,
  indent_by = 2,
  start_comments_with_one_space = FALSE,
  reindention = tidyverse_reindention(),
  math_token_spacing = tidyverse_math_token_spacing()
)

# Perform directory level styling
style_dir(getwd(), transformers = tidyverse)
Styling  112  files:
 aggregate.R            ℹ
 all.equal.R            ℹ
 apply.R                ℹ
 Arith.R                ℹ
 as.data.frame.R        ℹ
 barbiturates.R         ℹ
 bind.R                 ℹ
 call.list.R            ℹ
 chk.hy.R               ℹ
 chondro.R              ℹ
 collapse.R             ℹ
 colMeans.R             ℹ
 Compare.R              ℹ
 count_lines.R          ℹ
 cov.R                  ℹ
 decomposition.R        ℹ
 deprecated.R           ℹ
 dim.R                  ℹ
 dimnames.R             ℹ
 DollarNames.R          ℹ
 droplevels.R           ℹ
 empty.R                ℹ
 extract.R              ℹ
 factor2num.R           ℹ
 fileio.optional.R      ℹ
 fix_spc_colnames.R     ℹ
 flu.R                  ℹ
 getbynames.R           ℹ
 guesswavelength.R      ℹ
 hyperspec-class.R      ℹ
 hyperspec-package.R    ℹ
 initialize.R           ℹ
 labels.R               ℹ
 laser.R                ℹ
 levelplot.R            ℹ
 makeraster.R           ℹ
 map.identify.R         ℹ
 map.sel.poly.R         ℹ
 mark.dendrogram.R      ℹ
 mark.peak.R            ℹ
 Math.R                 ℹ
 matlab.palette.R       ℹ
 mean_sd.R              ℹ
 merge.R                ℹ
 mvtnorm.R              ℹ
 normalize01.R          ℹ
 options.R              ℹ
 orderwl.R              ℹ
 paracetamol.R          ℹ
 paste.row.R            ℹ
 pearson.dist.R         ℹ
 plot.R                 ℹ
 plotc.R                ℹ
 plotmap.R              ℹ
 plotmat.R              ℹ
 plotspc.R              ℹ
 plotvoronoi.R          ℹ
 qplot.R                ℹ
 qplotmixmap.R          ℹ
 quantile.R             ℹ
 rbind.fill.R           ℹ
 read.asc.Andor.R       ℹ
 read.asc.PerkinElmer.R ℹ
 read.ENVI.HySpex.R     ℹ
 read.ENVI.Nicolet.R    ℹ
 read.ENVI.R            ℹ
 read.ini.R             ℹ
 read.jdx.R             ℹ
 read.mat.Cytospec.R    ℹ
 read.mat.Witec.R       ℹ
 read.spc.Kaiser.R      ℹ
 read.spc.R             ℹ
 read.spc.Shimadzu.R    ℹ
 read.spe.R             ℹ
 read.txt.Horiba.R      ℹ
 read.txt.long.R        ℹ
 read.txt.Renishaw.R    ℹ
 read.txt.Shimadzu.R    ℹ
 read.txt.wide.R        ℹ
 read.txt.Witec.R       ℹ
 regexps.R              ✔
 replace.R              ℹ
 sample.R               ℹ
 scale.R                ℹ
 seq.R                  ℹ
 show.R                 ℹ
 spc.bin.R              ℹ
 spc.fit.poly.R         ℹ
 spc.identify.R         ℹ
 spc.loess.R            ℹ
 spc.NA.approx.R        ℹ
 spc.rubberband.R       ℹ
 spc.spline.R           ℹ
 split.R                ℹ
 split.string.R         ℹ
 splitdots.R            ℹ
 subset.R               ℹ
 Summary.R              ℹ
 sweep.R                ℹ
 trellis.factor.key.R   ℹ
 units.R                ℹ
 unittest.R             ℹ
 validate.R             ℹ
 vandermonde.R          ℹ
 wc.R                   ℹ
 wl.R                   ℹ
 wl2i.R                 ℹ
 wleval.R               ℹ
 write.txt.long.R       ℹ
 write.txt.wide.R       ℹ
 y-pastenames.R         ℹ
 zzz.R                  ℹ
────────────────────────────────────────
Status	Count	Legend
✔ 	1	File unchanged.
ℹ 	111	File changed.
✖ 	0	Styling threw an error.
────────────────────────────────────────
Please review the changes carefully!
Neat! styler outputs the changes it made and encourages users to review changes carefully!
3. Hard
Task: Tackle one of the “good first issues” in the
hyperSpec.tidyverseissue thread.
3.1. Contributing to the hyperSpec.tidyverse project
The goal of the hyperSpec.tidyverse repo is to create an R package that makes hyperSpec (hyperSpec objects) work smoothly with the tidyverse. Practically, this means making analog tidyverse/dplyr functions (e.g., select(), rename(), mutate(), transmute(), etc.) for hyperSpec objects. In the end, the hope is to support “wrangling of hyperSpec objects in a dplyr-like style”.
3.2. Picking a “good first issue”
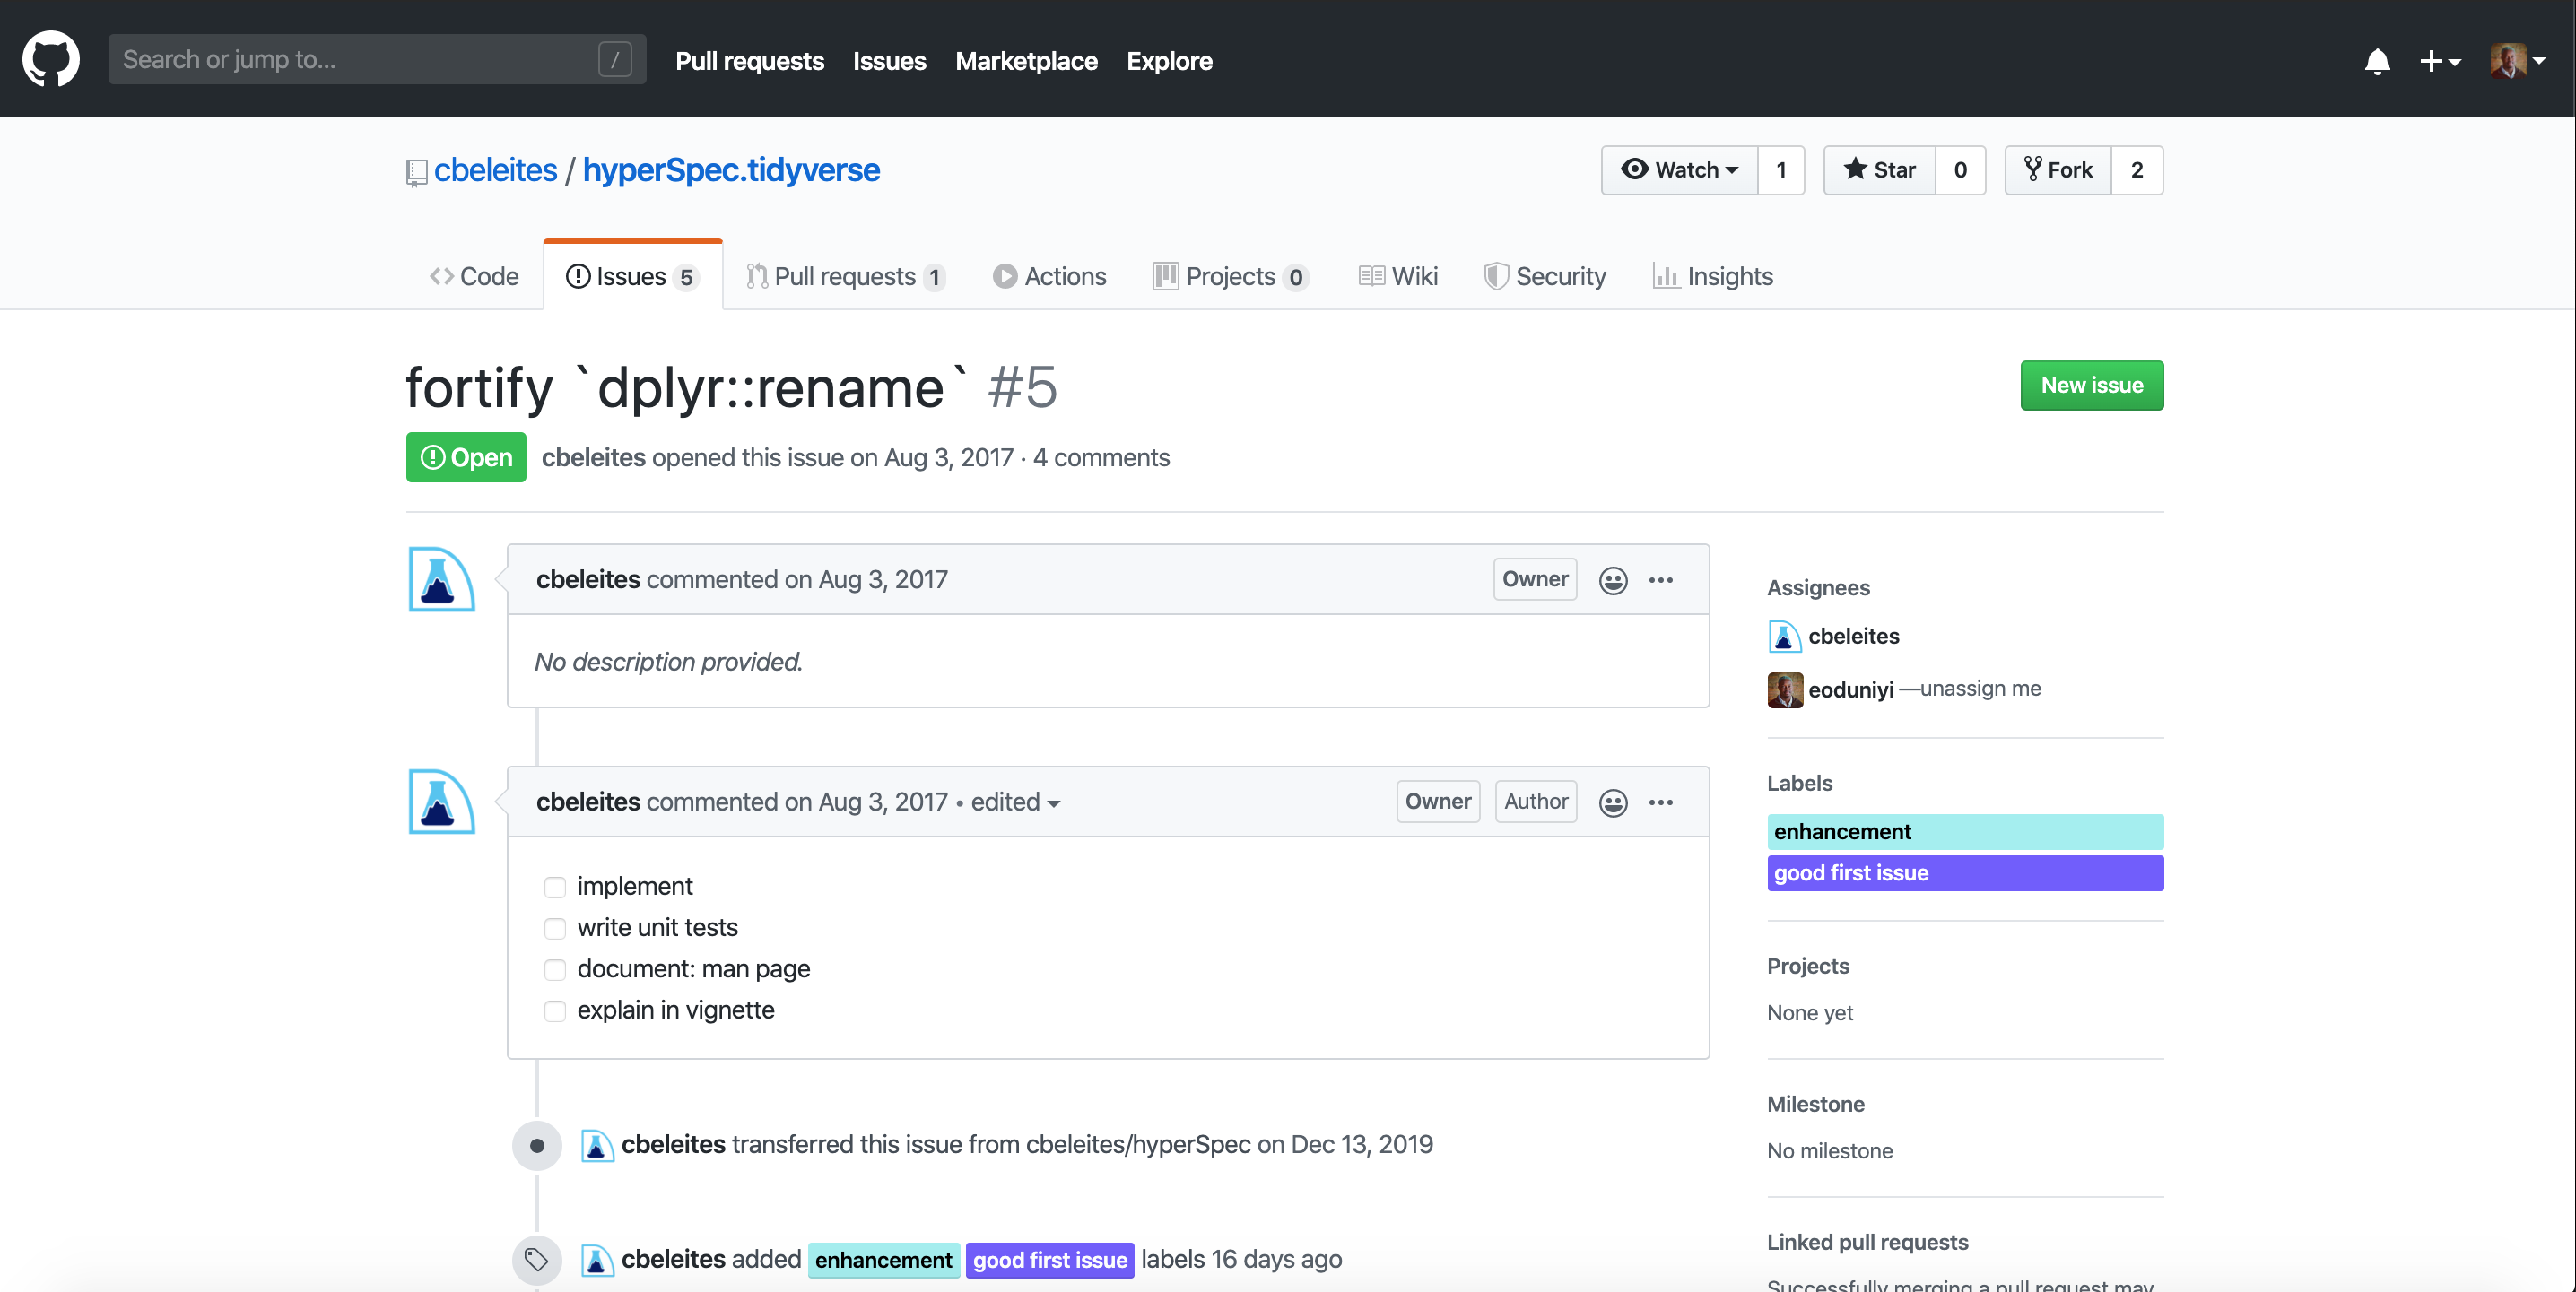
I decided to tackle issue #5 - dplyr::rename() because it was the first “good first issue” and although I’m not super familiar with tidyverse/dplyr, rename() seems like a straightforward function to implement.
3.3. Creating a structure to work on hyperSpec.tidyverse
I like to use Atom to manage projects and quickly develop coding ideas and RStudio for concrete implementation. Of course, before I can start working on my contribution I need to do:
- Fork the
hyperSpec.tidyverserepository - Clone the
hyperSpec.tidyverserepository locally - View project in Atom
- Open project in RStudio
3.4. Software Description
The task is to create a fortified version of dplyr::rename() so that it works smoothly with hyperSpec objects.

3.4.1. The nature of rename() and select()
The dplyr package is a grammar of data manipulation. This makes common data manipulation task intuitive. Unsurprisingly, R users often want to rename the columns of their data frames or even select subsets of their tables to do more fine-grained analysis. It turns outs, these two operations are pretty similar.
3.4.2. dplyr::rename()
# Load dplyr and test data package
library(dplyr)
library(hflights)
Attaching package: ‘dplyr’

The following objects are masked from ‘package:stats’:

    filter, lag

The following objects are masked from ‘package:base’:

    intersect, setdiff, setequal, union
# Create a data frame using test data
df <- data.frame(hflights)[1:3, 1:3]
df
| Year | Month | DayofMonth | |
|---|---|---|---|
| <int> | <int> | <int> | |
| 5424 | 2011 | 1 | 1 |
| 5425 | 2011 | 1 | 2 |
| 5426 | 2011 | 1 | 3 |
# Rename columns of data frame
df %>% rename(YearNewColName = Year) # same as rename(df, YearNewColName = Year)
| YearNewColName | Month | DayofMonth | |
|---|---|---|---|
| <int> | <int> | <int> | |
| 5424 | 2011 | 1 | 1 |
| 5425 | 2011 | 1 | 2 |
| 5426 | 2011 | 1 | 3 |
Observe df %>% rename(NewColName = OldColName, ...) only operates on the column names of the data frame and so while the column names of the data frame may be changed, the number of columns is preserved. So, if I pass in a data frame to
rename(), then the result will be an data frame.
dplyr::rename() is equivalent to:
names(df)[names(df) == "OldColName"] <- "NewColName"
3.4.3. dplyr::select()
# Select columns of data frame
df %>% select(Year) # same as select(df, year)
| Year | |
|---|---|
| <int> | |
| 5424 | 2011 |
| 5425 | 2011 |
| 5426 | 2011 |
Observe df %>% select(ColName1, ColName2, ...) selects a subset of the columns as specified by the column names. Thus, select operates on the entire data frame. So, if I pass in a data frame, then the result will be a data frame with
.
dplyr::select() is equivalent to:
df[names(df) == "OldColName"]
However, you can use select() to also rename columns. That is, you can give new names to the selected subset:
df %>% select(NewColName = OldColName, ...) is equivalent to:
df <- df[names(df) == "OldColName"]
names(df)[names(df) == "OldColName"] <- "NewColName"
# Rename column with select
df %>% select(YearNewColName = Year)
| YearNewColName | |
|---|---|
| <int> | |
| 5424 | 2011 |
| 5425 | 2011 |
| 5426 | 2011 |
3.5. Function Design
3.5.1. The nature of rename() and select() cont.
While both rename() and select() operate on data frames (i.e., tables with column names) the difference between the two functions is that the former only changes column names of the data frame while the latter creates a subset of the data frame; in doing so, the names (column names) of these subsets can be changed as well.
3.5.2. rename() and select() for hyperSpec
What does this mean for hyperSpec objects? Well, hyperSpec objects are a S4 class that contain 4 slots:
- @wavelength - numeric vector
- @data - a data frame with the spectra matrix ($spc)
- @labels - list of appropriate labels
- @log - …
3.5.3. Nature of hyperSpec objects
In fact, the hyperSpec package comes with five data sets (hyperSpec objects):
- chondro - a Raman map of chondrocytes in cartilage
- flu - a set of fluorescence spectra of a calibration series
- laser - a time series of an unstable laser emission
- paracetamol - a Raman spectrum of paracetamol (acetaminophene) ranging from 100 to 3200 cm−1 with overlapping wavelength ranges.
- barbiturates - GC-MS spectra with differing wavelength axes as a list of 286
hyperSpecobjects
Let’s take a look at the structure of these objects:
# Load hyperSpec, Data Explorer, networkD3, and cli packages
library(hyperSpec)
library(DataExplorer)
library(networkD3)

# Create a function for exploring the structure hyperSpec objects
explore.object <- function(obj){
    print(obj)
    diagonalNetwork(plot_str(obj, print_network = FALSE))
}

# Take a look at the five hyperSpec objects
print("chondro")
explore.object(chondro)

print("flu")
explore.object(flu)

print("laser")
explore.object(laser)

print("paracetamol")
explore.object(paracetamol)

# We'll avoid printing barbiturates as it contains 200+ hyperSpec objects
[1] "chondro"
hyperSpec object
875 spectra
5 data columns
300 data points / spectrum
wavelength: Delta * tilde(nu)/cm^-1 [numeric] 602 606 ... 1798
data: (875 rows x 5 columns)
1. y: y [numeric] -4.77 -4.77 ... 19.23
2. x: x [numeric] -11.55 -10.55 ... 22.45
3. filename: filename [character] rawdata/chondro.txt rawdata/chondro.txt ... rawdata/chondro.txt
4. clusters: clusters [factor] matrix matrix ... lacuna + NA
5. spc: I / a.u. [matrix300] 501.8194 500.4552 ... 169.2942 
[1] "flu"
hyperSpec object
6 spectra
3 data columns
181 data points / spectrum
wavelength: lambda/nm [numeric] 405.0 405.5 ... 495
data: (6 rows x 3 columns)
1. spc: I[fl]/"a.u." [matrix181] 27.15000 66.80133 ... 294.6495
2. filename: filename [character] rawdata/flu1.txt rawdata/flu2.txt ... rawdata/flu6.txt
3. c: c / (mg / l) [numeric] 0.05 0.10 ... 0.3 
[1] "laser"
hyperSpec object
84 spectra
3 data columns
36 data points / spectrum
wavelength: lambda/nm [numeric] 404.5828 404.6181 ... 405.8176
data: (84 rows x 3 columns)
1. t: t / s [numeric] 0 2 ... 5722
2. spc: I / a.u. [matrix36] 164.650 179.724 ... 112.086
3. filename: filename [character] rawdata/laser.txt.gz rawdata/laser.txt.gz ... rawdata/laser.txt.gz 
[1] "paracetamol"
hyperSpec object
1 spectra
2 data columns
4064 data points / spectrum
wavelength: Delta * tilde(nu)/cm^-1 [numeric] 96.7865 98.1432 ... 3200.07
data: (1 rows x 2 columns)
1. spc: I / a.u. [matrix4064] 2056.50 2224.84 ... 299.229
2. filename: filename [character] txt.Renishaw/paracetamol.txt 
So, not only does a hyperSpec object have to contain the 4 slots mentioned above, the @data slot must also contain the spectra matrix (hyperSpecObject@data$spc). Accordingly, the dplyr operations rename() and select() should only augment the @data slot. However, augmenting the data slot augments the @label slot. In other words, if I’m going to create a function that changes the column names of the data frame using dplyr::rename(), the function must also ensure that the spc column is not renamed and that the labels are correctly updated. Then, a function design (pseudo-code) for rename.hyperSpec() should look like this:
# Function design for rename.hyperSpec()
rename.hyperSpec() <- function(hyperSpecObject, NewColName = OldColName, ...){
  # Check if user passed in a hyperSpec object
  chk.hy(hyperSpecObject)
  # Use dplyr::rename() to rename hyperSpec object data slot
  res <- dplyr::rename(hyperSpecObject@data, NewColName = OldColName, ...)
  # Check if $spc was renamed
  if(spc.name.changed(res)){
    # Throw an error
    error("spc has been renamed")
  }else{
    # Update the data slot with newly renamed data frame
    hyperSpecObject@data <- res
    # Update labels of the hyperSpec object
    labels(hyperSpecObject) <- update.labels(hyperSpecObject)
    # Return hyperSpec object
    return{hyperSpecObject}
  }
}
3.6. Function Implementation
A few dplyr operations have already been implemented for hyperSpec (e.g., filter.hyperSpec() and select.hyperSpec()). Fortunately, dplyr::select() and dplyr::rename() are similar operations, so hyperSpec’s implementation of select() should be a good guide to follow for rename():
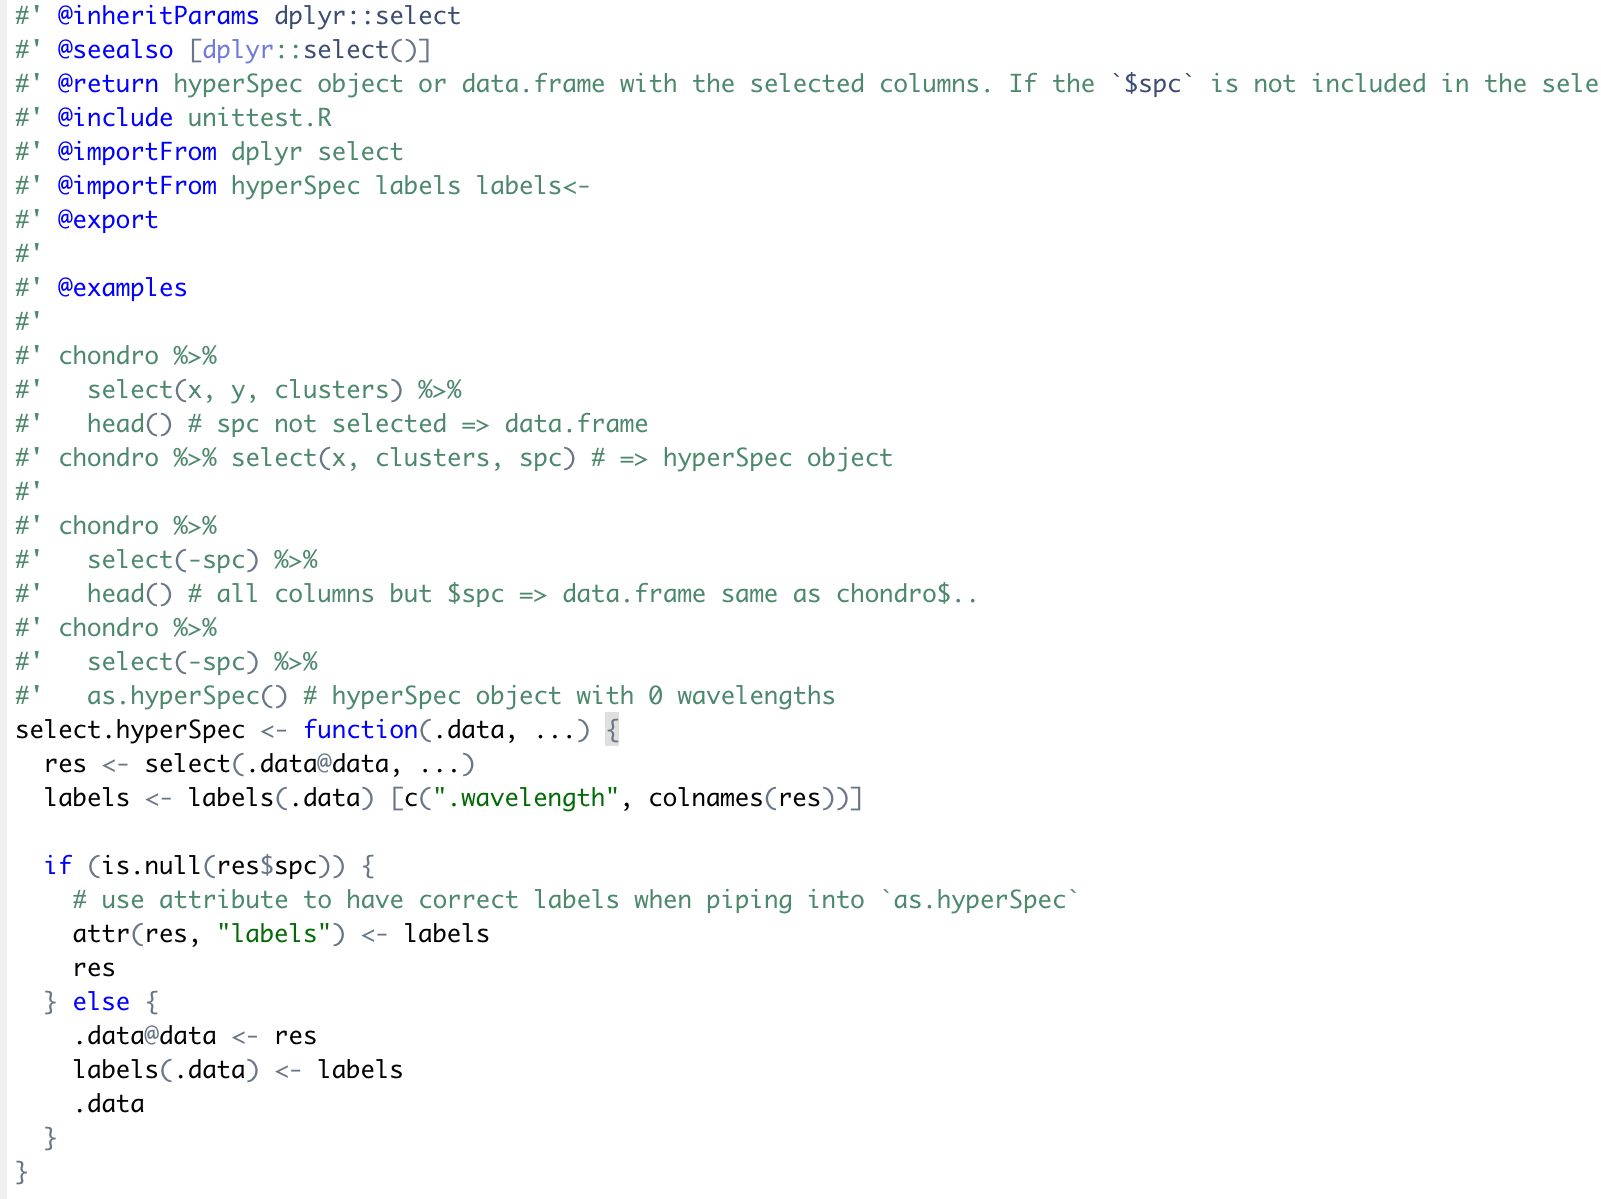
Using the above-mentioned function requirements and function design for rename.hyperSpec() and select.hyperSpec() as a guide, an implementation of rename() could be the following:
# Function implementation for rename.hyperSpec()
rename.hyperSpec <- function(.data, ...){
  # Check if user passed in a hyperSpec object
  chk.hy(.data)
  # Use dplyr::rename() to rename hyperSpec object data slot
  res <- rename(.data@data, ...)
  # Check if $spc was renamed
  if(!'spc' %in% colnames(res)){
    # Throw an error
    stop("$spc cannot be renamed")
  }else{
    # Get new and current column names
    labels.to.update <- setdiff(colnames(res), colnames(.data))
    labels.to.remove <- setdiff(colnames(.data), colnames(res))
    # Update the data slot with newly renamed data frame
    .data@data <- res
    # Update labels of hyperSpec object
    new.labels <- lapply(labels(.data, labels.to.update), as.expression)
    labels(.data)[c(labels.to.remove)] <- NULL
    labels(.data)[c(labels.to.update)] <- new.labels
    .data
  }
}
# Rename data frame of hyperSpec object
chondro %>% rename.hyperSpec(region = clusters)
chondro %>% rename.hyperSpec(spc2 = spc) # should throw an error
hyperSpec object
   875 spectra
   5 data columns
   300 data points / spectrum
wavelength: Delta * tilde(nu)/cm^-1 [numeric] 602 606 ... 1798
data:  (875 rows x 5 columns)
   1. y: y [numeric] -4.77 -4.77 ... 19.23
   2. x: x [numeric] -11.55 -10.55 ... 22.45
   3. filename: filename [character] rawdata/chondro.txt rawdata/chondro.txt ... rawdata/chondro.txt
   4. region: region [factor] matrix matrix ... lacuna + NA
   5. spc: I / a.u. [matrix300] 501.8194 500.4552 ... 169.2942

Error in rename.hyperSpec(., spc2 = spc): $spc cannot be renamed
Traceback:

1. chondro %>% rename.hyperSpec(spc2 = spc)
2. withVisible(eval(quote(`_fseq`(`_lhs`)), env, env))
3. eval(quote(`_fseq`(`_lhs`)), env, env)
4. eval(quote(`_fseq`(`_lhs`)), env, env)
5. `_fseq`(`_lhs`
6. freduce(value, `_function_list`)
7. withVisible(function_list[[k]](value))
8. function_list[[k]](value)
9. rename.hyperSpec(., spc2 = spc)
10. stop("$spc cannot be renamed")   # at line 9 of file <text>
3.7. Testing and Validation
Now that rename() has been implemented it’s important to test the code. Unit testing (UT) is an automated procedure for checking the correctness of pieces/components/cases of a function/module. The life cycle of UT and code development could like the following:
Note: It’s important to know whether or not there is a problem with your code or the unit test your wrote for the code.
3.7.1. Writing unit test in R
In R, UT is carried out through the testthat package. The basic structure of testthat test are the following:
test_that("a description of my test", {
        expect_condition(function_name(parameter), expected_result))
    })
See Hadley Wickham’s Testing chapter to get more information about setting up unit testing for R. Additionally, André Müller’s “Unit Testing in R” is a helpful resource for R test development.
3.7.2. Writing unit test for rename.hyperSpec()
Because the column renaming functionality is provided by dplyr::rename() I don’t need to test if that works (it’s already being tested). Instead, the main things I want to test is that rename() doesn’t allow the renaming of spc and that when the columns of the data frame are renamed the labels are correctly updated:
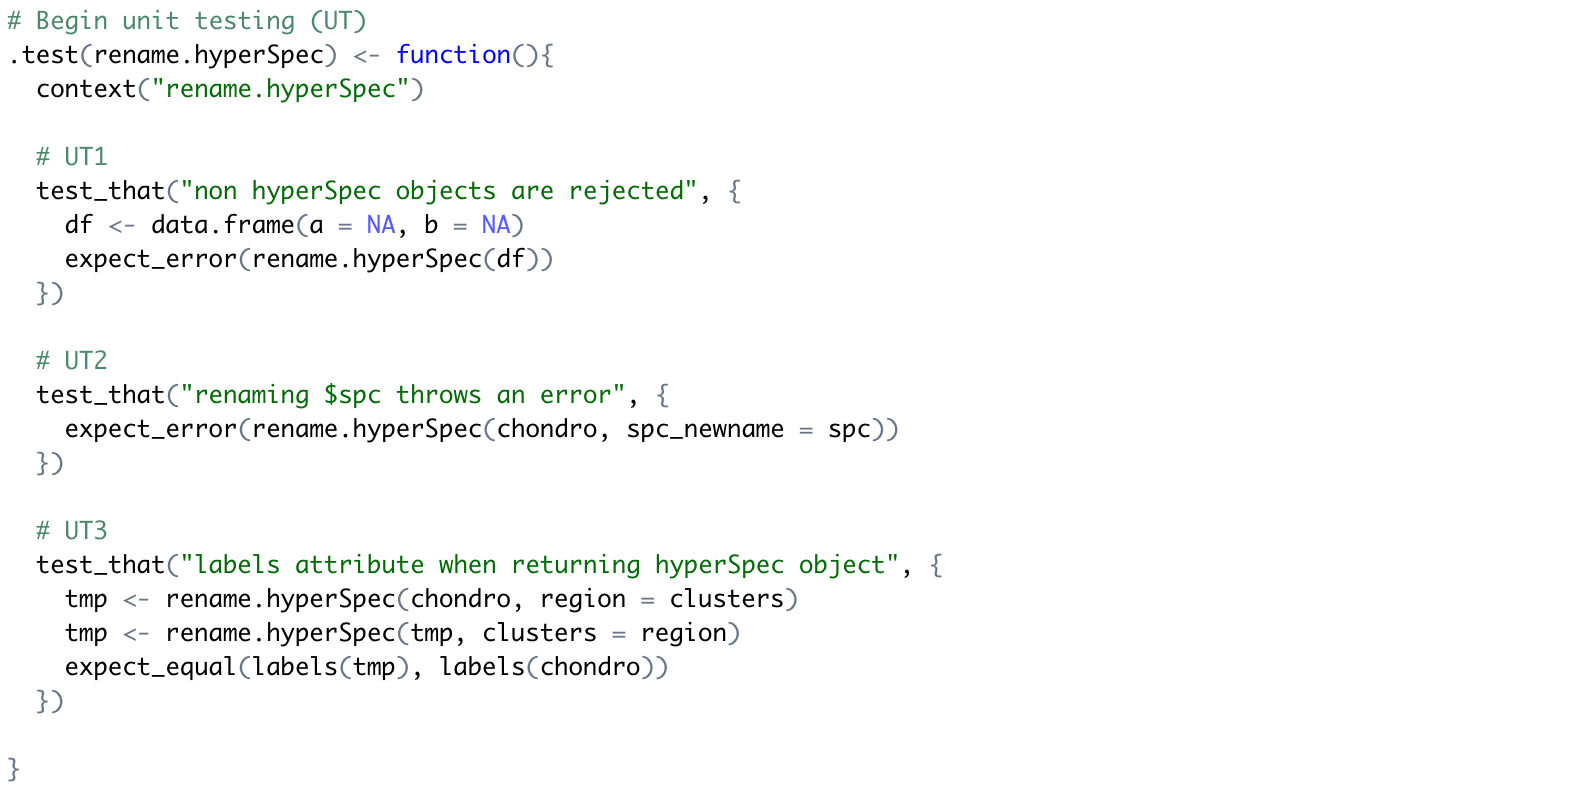
Certainly there are more test I could write for rename(), but I think these three are a good start. We can use covr to check the testing coverage:

Note: “One hundred percent unit test coverage does not mean we had good tests, or even that the tests are complete. The tests could be missing important data and only testing with data that succeeds, failing to test data that causes failures. One hundred percent unit test coverage doesn’t say anything about missing code, missing error handling, or missing requirements.” - John Ruberto
3.8. Documentation
Now that the function has been implemented and tested the last thing to do is document the function and provide an example is the package vingette. RStudio and the roxygen package makes it easy to build documentation for functions and packages:
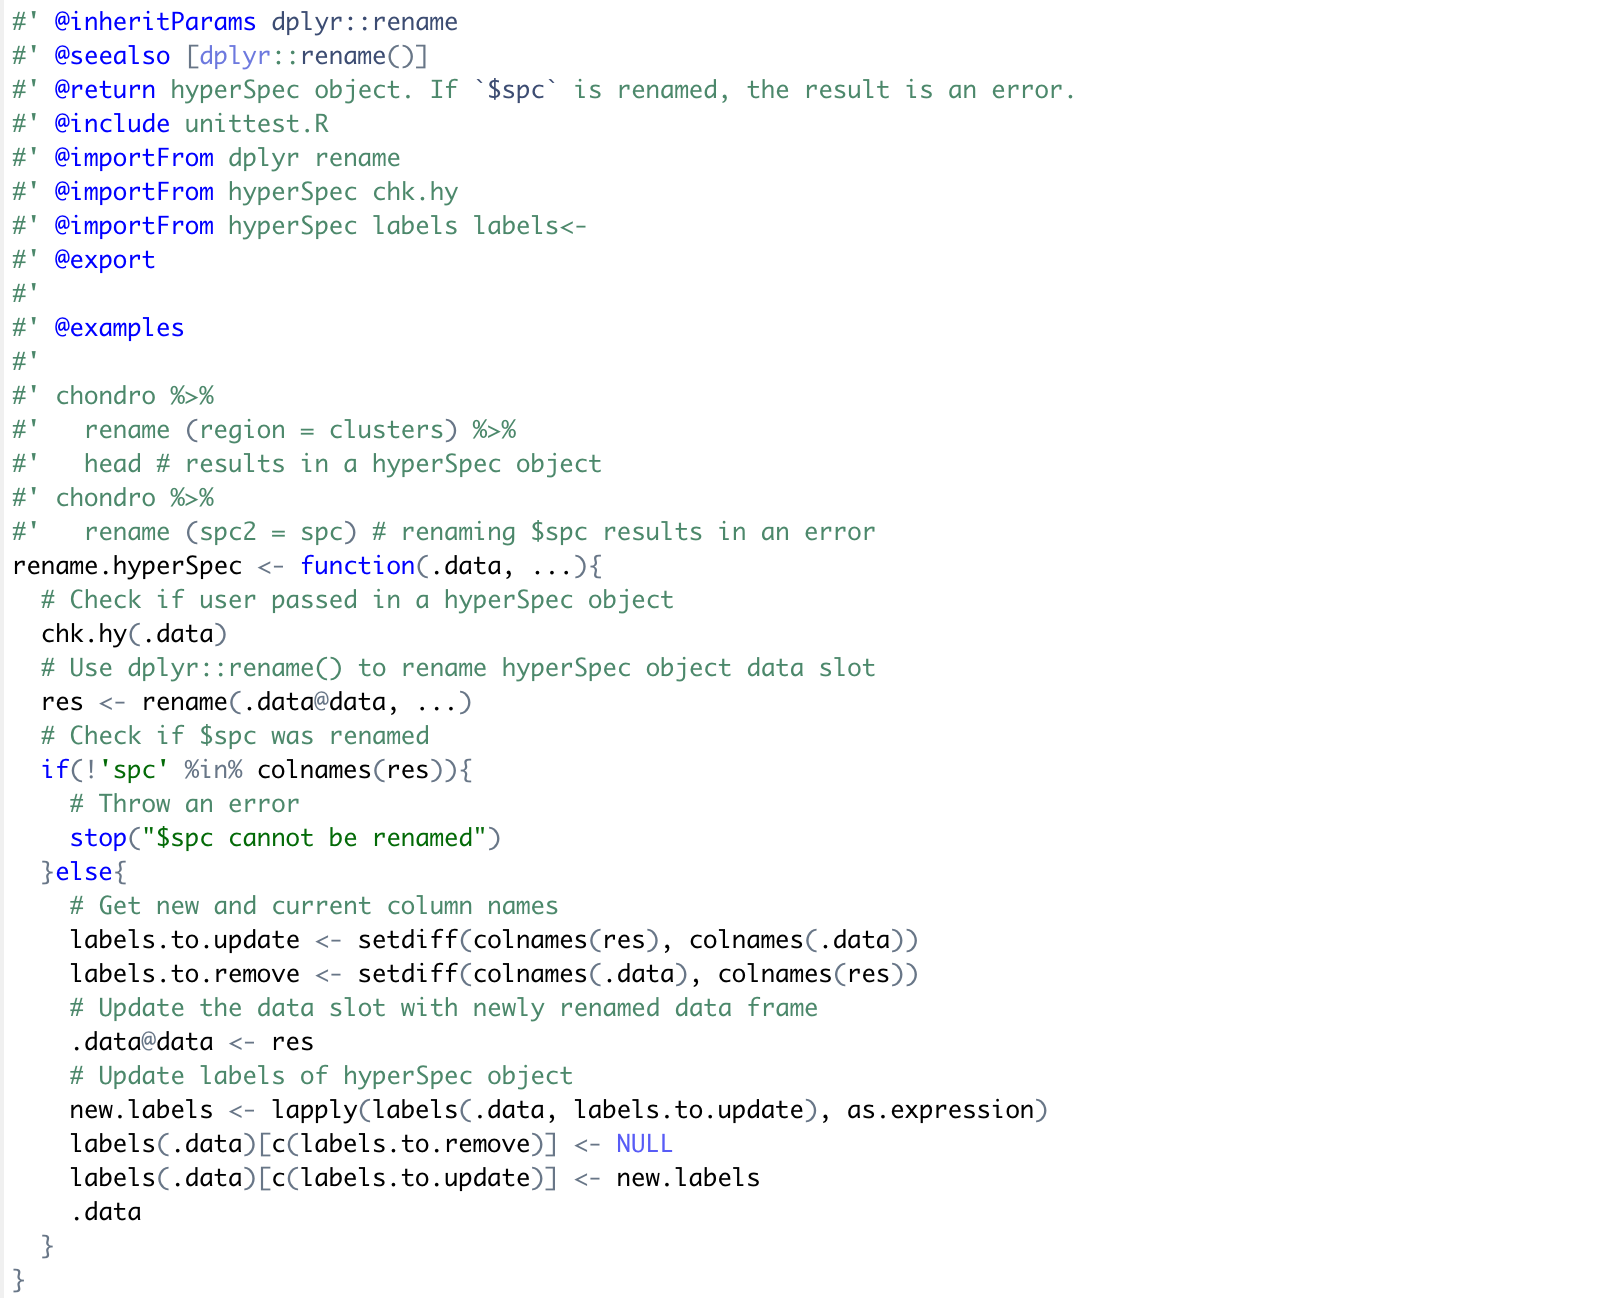
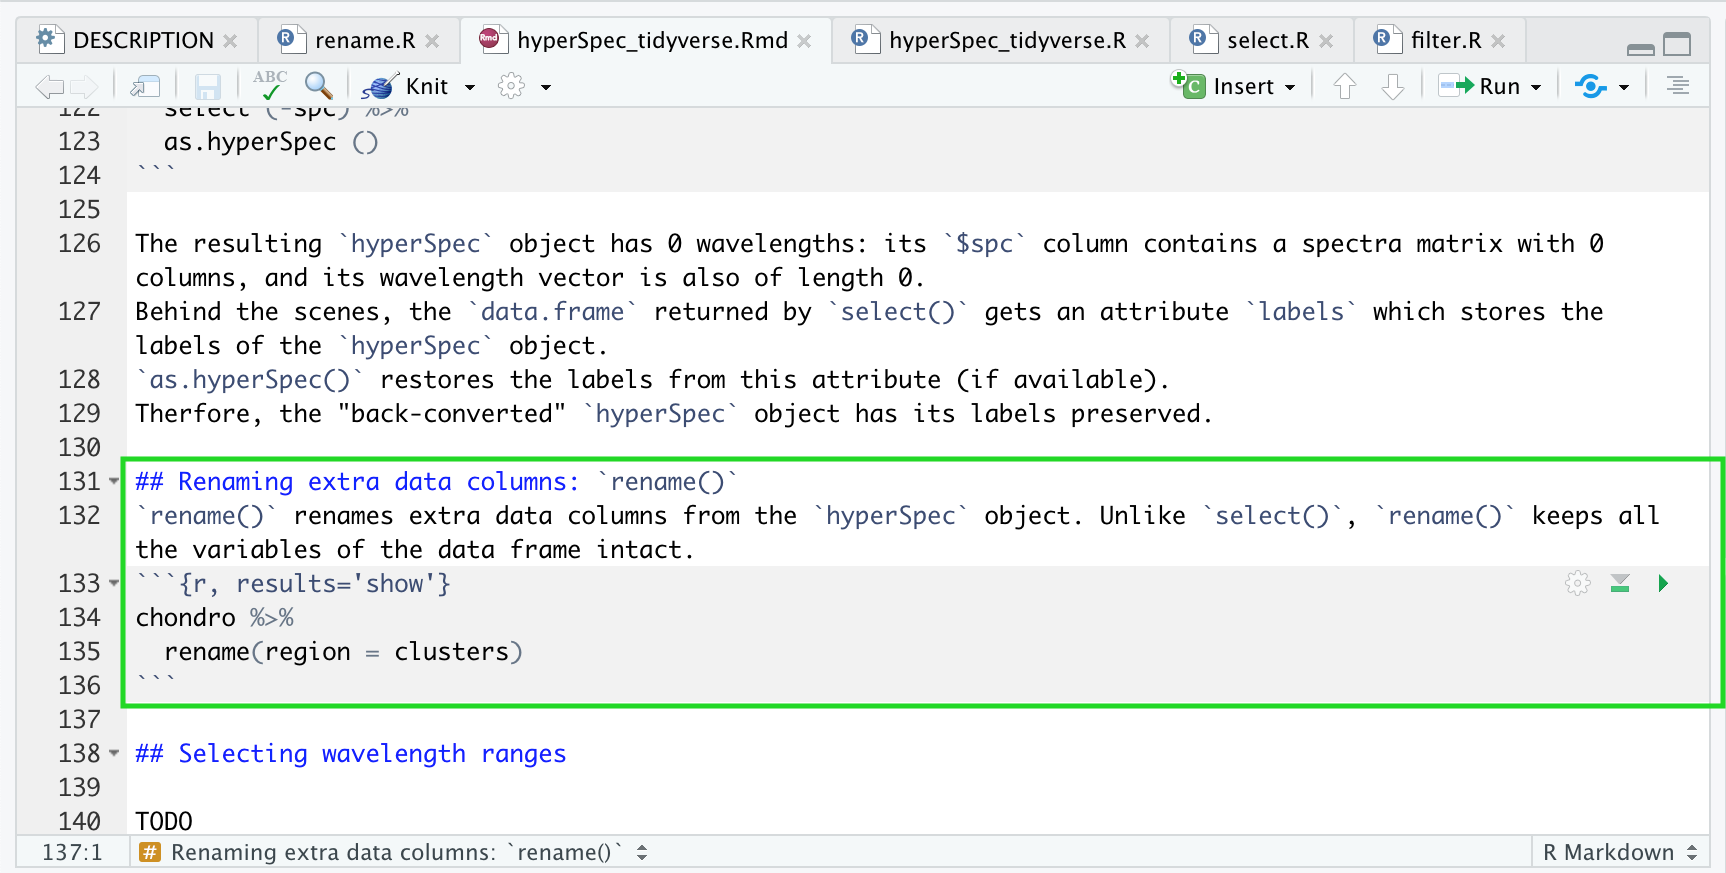
The documentation output generated by roxygen can be viewed here
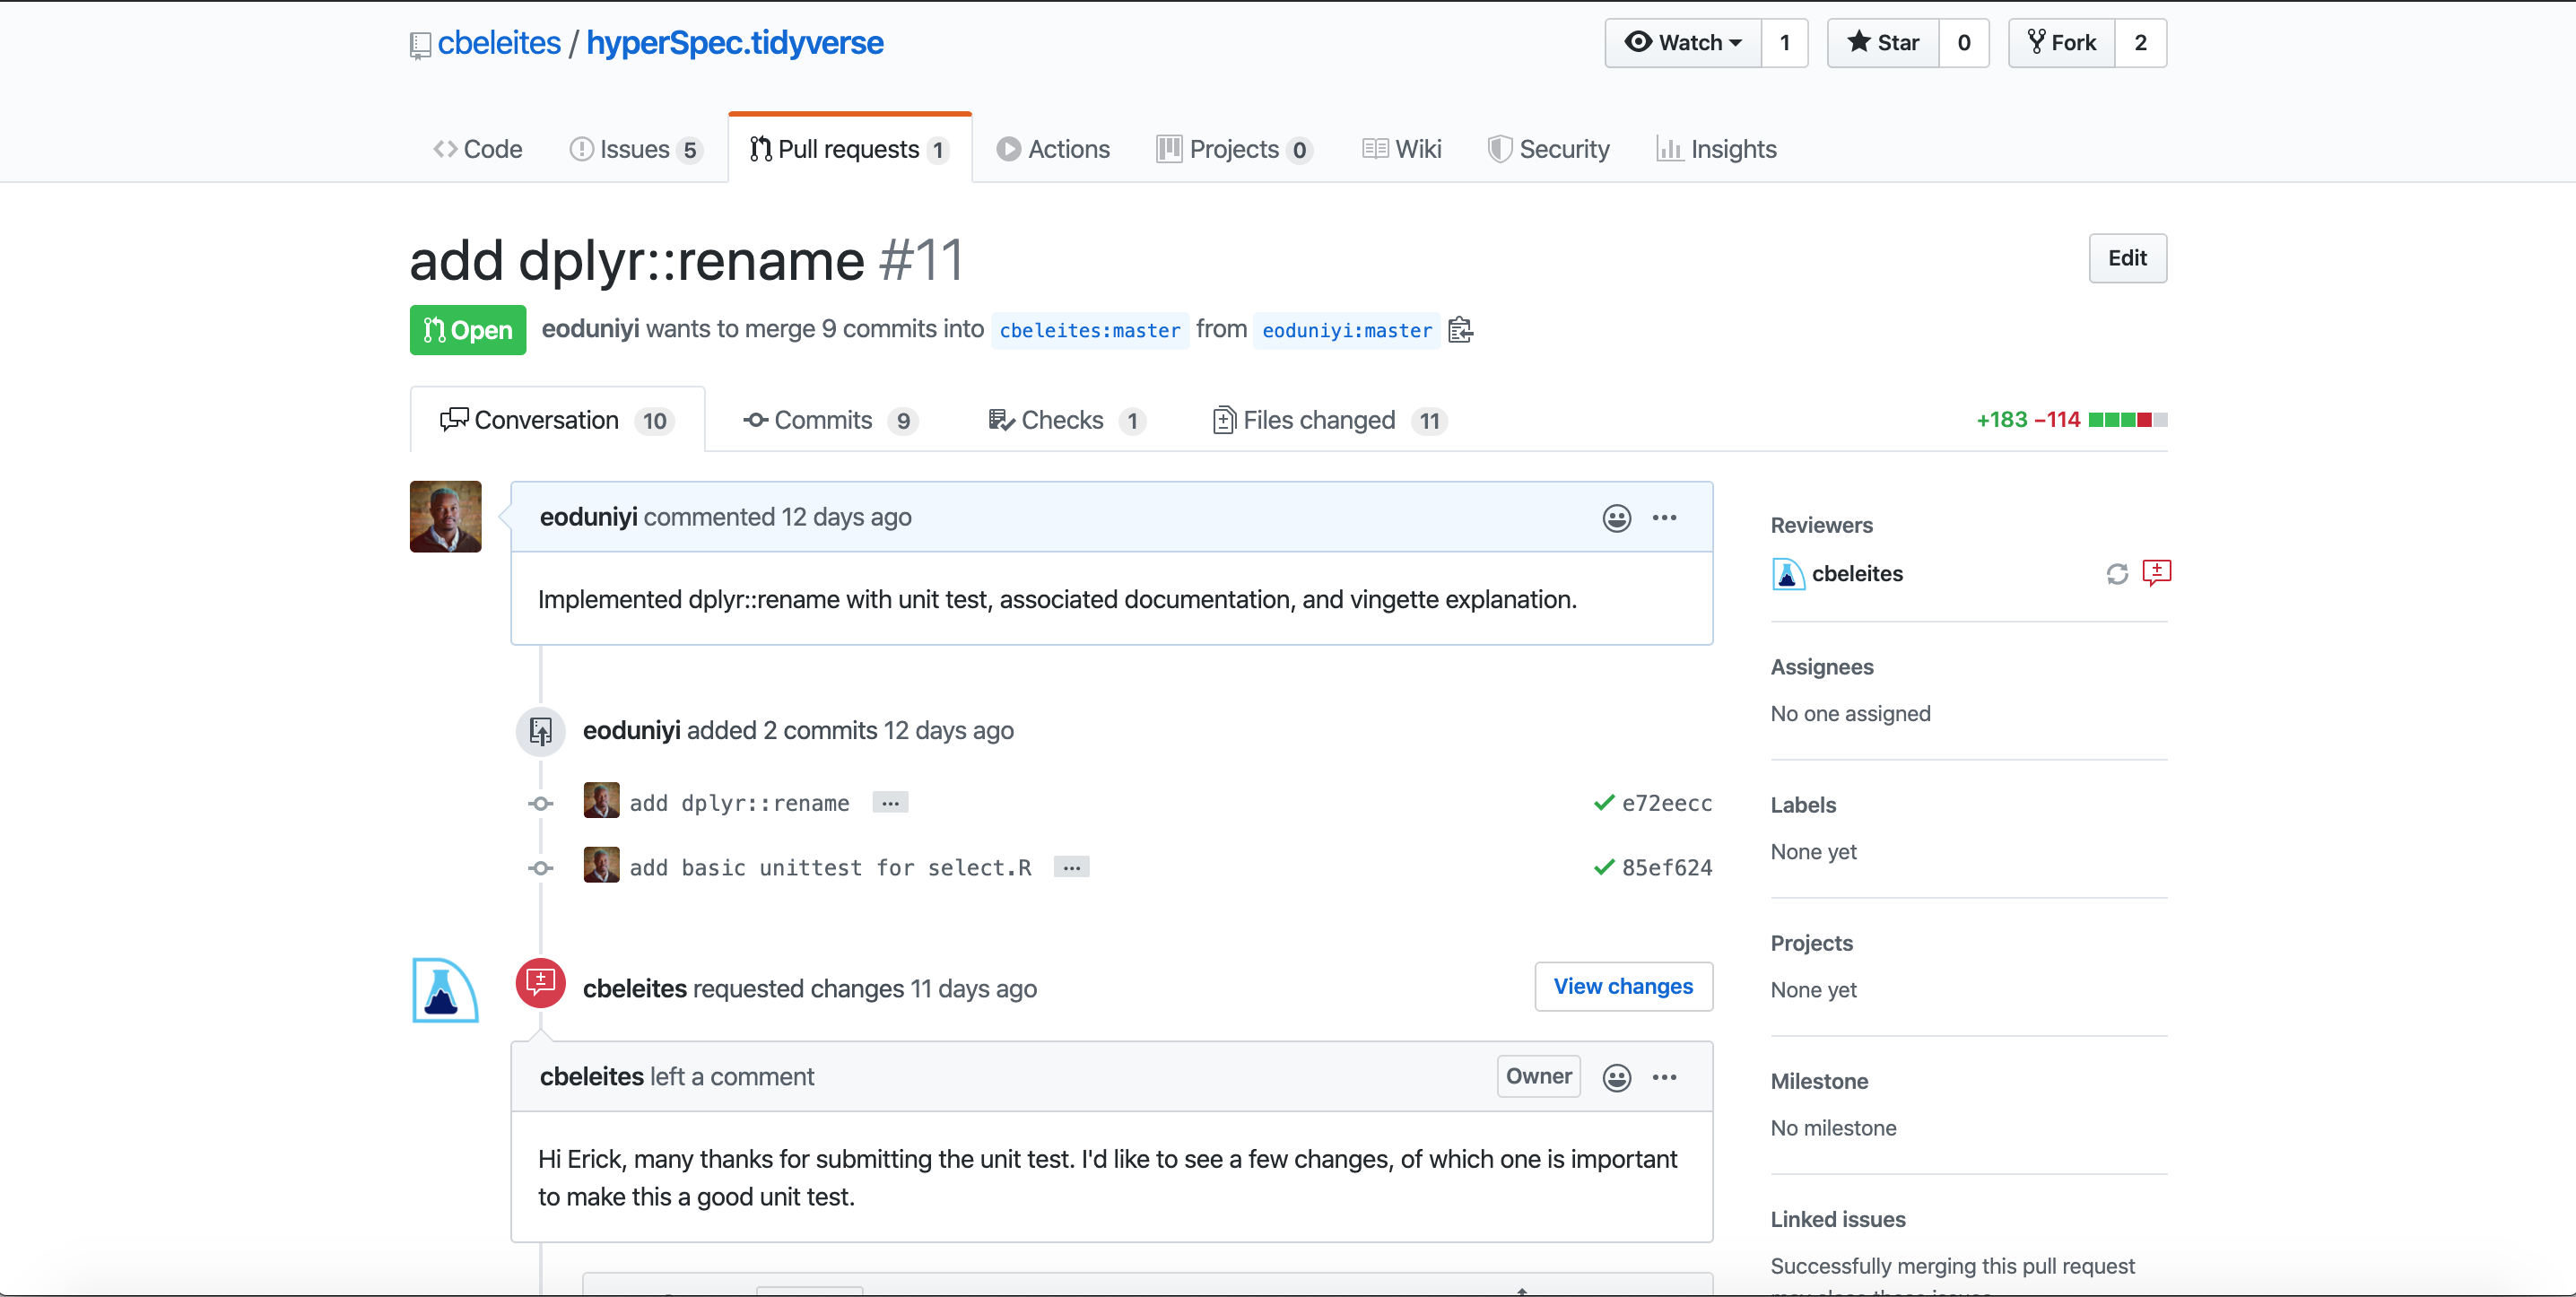
3.9. Submitting a pull request for rename.R
The last thing to do is commit and then submit a pull request for rename.R and wait for a code review
4. Very Hard
Task: Set up a github repo and R package skeleton and copy a hyperspec qplot function into the new package with one unit test.
I chose qplotspc because it seemed simple and because I wanted to know more about the spectra within the hyperSpec objects.
The main thing I’m trying to understand is how does one test a plotting function (maybe the ggplot2 repo has some good resources). Furthermore, I need to understand what the function does and how the function does it. Basically, I need to understand the parameters/arguments and how they get processed in the function body.
4.1. qplotspc() usage
See Vilmantas Gegzna’s post: hyperSpec Plotting Examples with ggplot2 to get familiar with qplotspc and other hyperSpec plotting functions.
4.2. qplotspc() parameters
The parameters of qplotspc are the following:
- x -
hyperSpecobject - wl.range - wavelength ranges to plot
- mapping - uses gpgplot’s geom_line?
- spc.nmax - maximum number of spectra to plot
- map.lineonly - if TRUE, mapping will be handed to ggplot2 geom_line instead of ggplot2 ggplot.
- debuglevel - if > 0, additional debug output is produced
4.3. qplotspc() function body
The function body of qplotspc is the following:
qplotspc <- function(x,
                     wl.range = TRUE, ...,
                     mapping = aes_string(x = ".wavelength", y = "spc", group = ".rownames"),
                     spc.nmax = hy.getOption("ggplot.spc.nmax"),
                     map.lineonly = FALSE,
                     debuglevel = hy.getOption("debuglevel"))
{
  chk.hy(x)
  validObject(x)

  ## cut away everything that isn't asked for _before_ transforming to data.frame
  if(nrow(x) > spc.nmax)
  {
    if(debuglevel >= 1L)
    {
      message("Number of spectra exceeds spc.nmax. Only the first ", spc.nmax, " are plotted.")
    }
    x <- x[seq_len(spc.nmax)]
  }
  wl.range <- wl2i(x, wl.range, unlist = FALSE)
  x <- x[, , unlist(wl.range), wl.index = TRUE]
  df <- as.long.df(x, rownames = TRUE, na.rm = FALSE) # with na.rm trouble with wl.range

  ## ranges go into facets
  if(length(wl.range) > 1L)
  {
    tmp <- wl.range
    for(r in seq_along(tmp))
    {
      tmp [[r]][TRUE] <- r
    }
    df$.wl.range <- rep(unlist(tmp), each = nrow(x))
  }
  df <- df[!is.na(df$spc), , drop = FALSE]
  if(map.lineonly)
  {
    p <- ggplot(df) +
      geom_line(mapping = mapping, ...)
  }
  else
  {
    p <- ggplot(df, mapping = mapping) +
      geom_line(...)
  }
  p <- p + xlab(labels(x, ".wavelength")) + ylab(labels(x, "spc"))
  if(!is.null(df$.wl.range))
  {
    p <- p + facet_grid(. ~ .wl.range,
                        labeller = as_labeller(rep(NA, nlevels(df$.wl.range))),
                        scales = "free", space = "free") +
      theme(strip.text.x = element_text(size = 0))
  }
  p
}
4.3.1. Understanding the pieces of qplotspc
Okay, clearly there is a bunch of stuff going on in this function, so let’s try and break this into pieces:
piece_1: parameters list
function(x, # expects a hyperSpec object
         wl.range = TRUE, # defaults to true => will plot the wavelength ranges
         ..., # passes additional arguments to ggplot geom_line()
         mapping = aes_string(x = ".wavelength", y = "spc", group = ".rownames"), # map the variables in the data to visual properties
         spc.nmax = hy.getOption("ggplot.spc.nmax"), # gets the number of spectra to be plotted based on the current package option
         map.lineonly = FALSE, # defaults to handing mapping to ggplot2 ggplot
         debuglevel = hy.getOption("debuglevel") # gets the debuglevel based on the current hyperSpec package option
       )
piece_2: checking validity of hyperSpec object
chk.hy(x)
validObject(x)
piece_3: transforming hyperSpec object into a data frame
# Collect the first spc.nmax number of spectra
if(nrow(x) > spc.nmax)
{
  # Report warning to user
  if(debuglevel >= 1L)
  {
    message("Number of spectra exceeds spc.nmax. Only the first ", spc.nmax, " are plotted.")
  }
  # Collect a subset of the hyperSpec object's spectra (i.e., number of rows)
  x <- x[seq_len(spc.nmax)]
}
# Get indices of specified wavelength ranges
wl.range <- wl2i(x, wl.range, unlist = FALSE)
# Collect a subset of the hyperSpec object's wavelength (i.e., number of columns)
x <- x[, , unlist(wl.range), wl.index = TRUE]
# Turn hyperSpec object into a data frame
df <- as.long.df(x, rownames = TRUE, na.rm = FALSE) # with na.rm trouble with wl.range
piece_4: turning ranges into facets
# Replace the wavelength ranges with a vector containing 1 to length(wl.ranges)
if(length(wl.range) > 1L)
{
  tmp <- wl.range
  for(r in seq_along(tmp))
  {
    tmp [[r]][TRUE] <- r
  }
  # Update wavelength ranges for all rows
  df$.wl.range <- rep(unlist(tmp), each = nrow(x))
}
# Collect non NA rows and ensure a data frame is returned
df <- df[!is.na(df$spc), , drop = FALSE]
piece_5: Handling map.lineonly input
# Let geom_line handle mapping
if(map.lineonly)
{
  p <- ggplot(df) +
    geom_line(mapping = mapping, ...)
}
# Let ggplot handle mapping
else
{
  p <- ggplot(df, mapping = mapping) +
    geom_line(...)
}
# Add x and y labels to plot
p <- p + xlab(labels(x, ".wavelength")) + ylab(labels(x, "spc"))
piece_6: adding facets
# Check if the data frame has wavelength ranges
if(!is.null(df$.wl.range))
{
  # Add facets and theme to plot
  p <- p + facet_grid(. ~ .wl.range,
                      labeller = as_labeller(rep(NA, nlevels(df$.wl.range))),
                      scales = "free", space = "free") +
    theme(strip.text.x = element_text(size = 0))
}
# Return plot
p
In conclusion, we broke down qplotspc() into six pieces, divided according to the start of control structures (i.e., if()). This was done to better understand how the function arguments were being handled based on the user’s input. This was also done to try and develop a more comprehensive unit test. Now, hopefully, it’s a little more clear how to test each part of the code.
4.4. Writing unit test for qplotspc
Again, the plan is to write one unit test for each part of the function:

See for the remaining unittest
Finally, check package coverage:
